Thursday, July 31, 2014

Lesson 2: Strike price and Option Chain

In this lesson we will learn a few new terms, and introduce the option chain. Be sure to check out Lesson 1 if you need to.

Strike or Strike Price
  • The strike price or strike is what the options are trading at in comparison to the underlying stock. These can be represented in $.50, $1.00, and even $5.00 increments depending on how big of a move any given underlying is expected to make. 
At the Money, In the Money, and Out of the Money
  • At the Money refers to the current strike price at which the underlying stock is trading at. For example, if the Stock XYZ is trading at 97, then your At the Money (ATM for short) strike will be 97.
  • In the Money refers to any strike that falls within the parameters of Intrinsic value (we'll discuss Intrinsic vs. Extrinsic value in Lesson 3). In other words, it is any strike that is above the ATM strike on the Call side, and any strike that falls below the ATM strike on the Put side.
  • Out of the Money refers to any strike that falls within the parameters of Extrinsic value. This is essentially the opposite of the ITM (In the Money) definition. So, any OTM (Out of the Money) strike is what falls below the ATM strike on the Call side, and whats lies above the ATM strike on the Put side.
If that's too confusing (which at first it may be), then here is a visual representation of the option chain:


In this option chain, just like any other, the Calls are on the left side, and the Puts are on the right side.

As you can also see in the picture. The option chain has number of different columns that contain specific information. The Bid, and the Ask columns will be the same for any option chain you look at. All of the other columns are customize-able, and will vary based on the information you wish to see.

So what are the Bid/Ask columns about?
  • The Bid column represents the current market price if you wish to sell (or short) the option. As you can see, both Calls, and Puts have a Bid/Ask spread. Meaning you can Buy or Sell Calls, and Puts as discussed in Lesson 1.
  • The Ask column represents the current market price if you wish to buy the Call or Put option.
*Trading Tip: If you want the most competitive, and best price, never use the Bid/Ask as you see in the chain. There is always a Theoretical Price (or Theo Price as you see in the chain above) that will most likely be filled, and you save some money. The Theo price is typically the difference between the Bid, and the Ask. So, if you can't add the Theo price to your option chain. Just split the difference between the Bid/Ask, and you have it.*

Alright, that is the end of Lesson 2. It should be enough to help you expand your working knowledge of Options Trading, and help you stay sane enough to remember what taught. Remember, if you have any questions, feel free to leave them in the comments.

Wednesday, July 23, 2014

Taking Profits: SPX Calendar Spread

According to the rules in my trading plan, I took profits on the SPX Calendar Spread that I placed just last week.

My profit taking rules are simple: When this trade gets to 15-20% profit, I remove the trade. We originally purchased this spread for 11.50 and were able to sell it back for 13.90. That is a profit of 2.40 or $240 per contract, and a profit of 20.8% on capital.

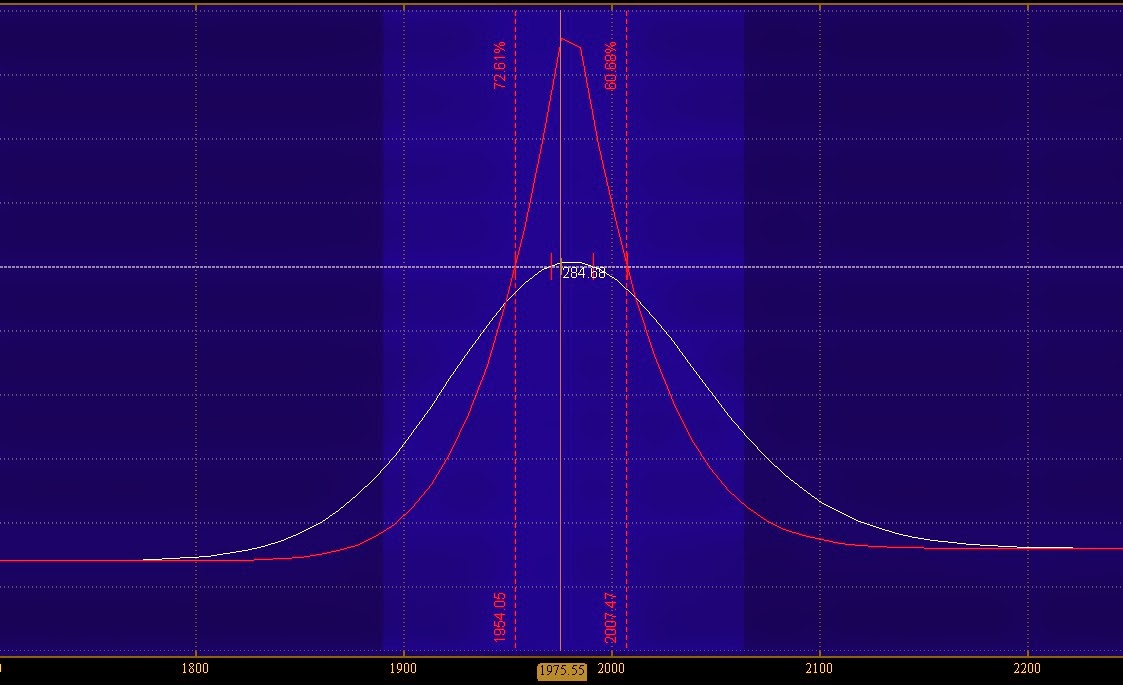
Here is a look at what our risk profile looks like when we come into a profit like this so cleanly:


The solid white line shows our current profit relative to our max profit/loss which is represented by the solid red line. The current price at which we are trading is shown on the dotted white line. It is represented by the orange vertical line.

Now this trade only took 1 week for us to come into a profit, and no adjustments were needed. But that is not how every one of these trades will turn out. Since this is an income trade, I will continue to place them every month so at some point I will be able to show you how I make adjustments, and when I decide when the trade will not work out.

Tuesday, July 22, 2014

Useful Trading Tools: IV% Rank, and % Change thinkscripts for thinkorswim

There is a tool that I have come to use, and cherish every day in my path to becoming a better trader. I took this tool from the very first segment of "Game Changers" video's posted from TastyTrade, which is simply a visual representation of the IV% rank, and %Pricechange over a period of time (the default is 10 days, but you may change that at your discretion) shown in the upper left corner of your ThinkorSwim chart.


This information at a glance proves to be very useful in monitoring for trade set-ups, and strategies. I personally use it to also gauge the general market environment.

If you're interested in adding this to your quiver here is the thinkscript taken from the TastyTrade video as mentioned above: 

*Please note that I do not take any credit for this thinkscript, but only wish to share something that I find very helpful.*

Price Percentile Script:

1) Go to 'Charts' tab
2) Click on the "eye-dropper" icon (officially called "edit studies icon"...same line where you type in the ticker same symbol, first icon moving left to right)
3) Click on "New"... Lower left hand corner
4) Delete everything in the box. (plot Data = close;)
5) Paste the entire code listed below
6) Name the study PricePercent
7) Click 'OK'
8) Click 'Apply'
9) Click 'Ok'

input length = 10;
input price = FundamentalType.CLOSE;
input pricePercentUP = 5.0;
input pricePercentDOWN = -5.0;

def priceday= Fundamental(price,period = aggregationPeriod.DAY);
def high=Highest(priceday[1],length);
def low=Lowest(priceday[1],length);
def PcntChHigh= 100 * (priceday / high -1);
def PcntChLow= 100 * (priceday /low -1);
def PercentChg = if(AbsValue(PcntChHigh)>=AbsValue(PcntChLow),
Round(PcntChHigh, 2),
Round(PcntChlow, 2));

AddLabel(1, Concat ("% Price Chng:", PercentChg ),if percentChg >= pricePercentUP then color.dark_green else if percentChg <= pricePercentDOWN then color.red else color.gray); 
------------------------------------------------------------------------------------------------------
IV Percentile Script: 

1) Go to 'Charts' tab
2) Click on the "eye-dropper" icon (officially called "edit studies icon"...same line where you type in the ticker same symbol, first icon moving left to right)
3) Click on "New"... Lower left hand corner
4) Delete everything in the box. (plot Data = close;)
5) Paste the entire code listed below
6) Name the Study
7) Click 'OK'
8) Click 'Apply'
9) Click 'OK'
 
declare upper;
input period = AggregationPeriod.DAY ;
#hint period: time period to use for aggregating implied volatility.
input length =252 ;
#hint length: #bars to use in implied volatility calculation.
def ivGapHi = if isnan(imp_volatility(period=period)) then 99999999999 else imp_volatility(period=period);
def ivGapLo = if isnan(imp_volatility(period=period)) then -99999999999 else imp_volatility(period=period);
def periodHigh = highest( ivGapLo,length=length);
def periodLow = lowest( ivGapHi, length=length);
def ivRange = periodHigh - periodLow ;
def ivp = round( 100*(imp_volatility(period=period) - periodLow)/ivRange, 0);
 
AddLabel(1, Concat("IV% ", ivp), if ivp > 80
     then Color.Green
     else if ivp < 80 and ivp > 50
     then Color.Yellow
     else color.Red);

Hints:     
a) Use 252 as input length for 1-year or 52-week IV percentile
b) You can change 252 to 189 for 9-month IV percentile
c) You can change 252 to 126 for 6-month IV percentile


Thursday, July 17, 2014

Options Trading Update: Calendar Spread

I know it's been some time since I've updated the blog, but I have not stopped trading! I have switched gears in how I approach options trading though, and want to share what I've been doing lately. Instead of trying to capture weekly gains, I've switched to a more conservative, and longer term swing trading approach which not only feels better, but is less stressful, and provides more time for adjustments if needed.

Here's the last trade I placed (which was yesterday):


* CALENDAR 11.50


100 SEP 14 1980 CALL

-


100 AUG 14 1980 CALL

+


I purchased, or bought the SPX 1980 September Calender for 11.50

This means I sold the 1980 CALLS for the SEP expiration, and bought the 1980 CALLS for the AUG expiration. The reason being, is that calendar spreads can profit from Volatility increases (High Vega), and since we are in a low volatility market, it stands to reason that we can possibly see some volatility jump at some point in time. It also gives me a 68% probability of profit, with a starting theta decay at around $100/day.

Here's what the risk profile looks like:


Now, I'm not planning on taking this all the way to the expiration date. The goal is to take 15-20% profit, and risk 10-15% of the capital used. I'll update if an adjustment is needed, and show you how I do that.

Stay tuned for the outcome of the trade.